


Data
We accessed course curricula by collecting course syllabi uploaded to Open Syllabus ( We chose to analyze syllabi instead of other data sources such as course catalogs because syllabi provide rich information about higher education curricula through sections such as course descriptions or learning objectives. Open Syllabus is a non-profit research organization collecting millions of syllabi. The main purpose of its data collection is to encourage colleges to share more syllabi, which can help textbook authors, professors, and curriculum developers (Nowogrodzki, 2016). While Open Syllabus has collected syllabi from around 140 countries, about two thirds of the syllabi are from the United States, the United Kingdom, Australia, and Canada. Open Syllabus data are collected primarily by crawling publicly accessible university websites and are regularly updated (Open Syllabus, 2023). The syllabi data in Open Syllabus have been repurposed multiple times in previous literature, which substantiates its reliable quality and scale of the data (Biasi and Ma, 2022; Bourrier and Thelwall, 2020).
From the Open Syllabus database, we collected syllabi from 2004 to 2019, a period that precedes the outbreak of Covid-19. Since Covid-19 brought substantial challenges to higher education, many of which have not been fully resolved, we restricted our analysis to the pre-pandemic era. We further limited our dataset to syllabi from four-year colleges and graduate schools in the United States in order to ensure a relatively coherent empirical scope. Our collected syllabi covered 62 academic disciplines as defined by Open Syllabus. We web-scraped up to 10,000 syllabi per year for each discipline in June, 2023 because the website limited users to access 10,000 syllabi per search. Year and discipline were the most effective filters for narrowing down search results, but this still left us unable to collect complete data when search results returned more than 10,000 syllabi. We contacted the organization for help with this issue, but they were not able to provide a solution that met our needs. While the scraped syllabi included various class-related details such as reading materials, our analysis focused on the course titles and course descriptions to explore the intellectual nature of the courses. We also considered analyzing the reading materials as previous literature on interdisciplinary research often measures interdisciplinarity by examining the composition of a reference list. However, we dropped these data because there are too many missing values, which may undermine the study’s robustness. When we checked the five largest disciplines (business, mathematics, computer science, English literature, engineering), approximately 48% of syllabi lack any information about reading lists. We also used learning outcomes to detect pedagogical strategies. However, this section should be interpreted with caution because 39% of syllabi lack information in this section. The missing data were more or less evenly distributed across all five broad fields. Additionally, we used the disciplinary categories assigned by Open Syllabus and recorded the year each course was provided.
Before conducting text analysis of syllabi, we pre-processed the data in three steps. First, we re-classified the 61 disciplines into five broad fields: arts and humanities, engineering and technology, medicine and health sciences, natural sciences, and social sciences. (Details of this categorization can be found in Supplementary Table S1.) Among 62 disciplines, we excluded “Basic Skills” because it does not have a strong disciplinary orientation. All syllabi uploaded to Open Syllabus were categorized into one of these 61 disciplines. Newly emerged interdisciplinary courses, such as those focusing on digital humanities or bioinformatics, were not the exception. These new courses were often sorted into a discipline aligned with their substantive interests. For instance, digital humanities classes were classified under English literature, while bioinformatics classes were classified under biology. By observing the temporal patterns across these broad fields, we highlighted the major changes in interdisciplinary education.
Second, we controlled the number of syllabi in the dataset by year. As more and more universities started sharing their syllabi online, the number of available ones increased. For example, the number of syllabi in 2019 was six times higher than 2004 (see Supplementary Fig. S1). To mitigate the influence of sample size on temporal patterns, particularly in the topic model, we randomly sampled 30,000 syllabi per year, resulting in a total of 480,000 syllabi between 2004 and 2019. If we use the raw data without sampling, the topic model will reflect more recent topics than earlier ones. Since our main analytical strategy involved comparing temporal patterns of interdisciplinarity in syllabi, we minimized confounding factors as much as possible through this sampling process. The sampling process helped us fairly observe the temporal trend without being biased towards recent periods that have the larger volume of data. Lastly, we filtered out syllabi from non-U.S. universities (1767 syllabi, 0.4%), which made the final dataset of 478,233 syllabi.
Syllabi were not equally distributed in five broad fields as well. In Fig. 1, we showed that the largest broad field, social sciences, has about seven times more syllabi than the smallest broad field, medicine and health sciences. However, we did not go through the additional sampling process to adjust the imbalance in broad field. It may affect how the topic model captures patterns in detail depending on the broad field, but since we group these topics by broad field later, the issue of different resolution will have a minimal effect on our results. In this case, we chose to use the data as they are as much as possible.

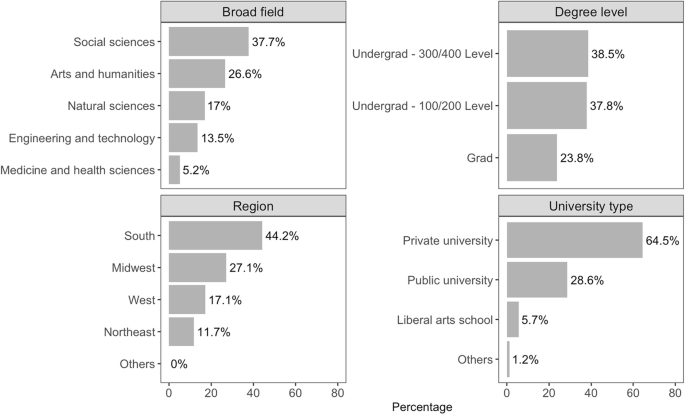
Descriptive statistics of the analyzed syllabi between 2004 and 2019 (N = 478,233).
Figure 1 presents descriptive statistics of the final dataset. Among the five broad fields, social sciences account for the largest share of syllabi, followed by arts and humanities, natural sciences, engineering and technology, and medicine and health sciences. By degree level, 76.2% of syllabi are from undergraduate courses, with lower- and upper-division classes almost evenly split, and 24% from graduate courses. Regionally, the South contributes the most syllabi, followed by the Midwest, West, and Northeast. In terms of university type, 64.5% come from private universities and 28.6% from public universities.
Third, we pre-processed the text data through multiple steps. Using the spaCy package (v.3.7) in Python, we tokenized the contents of course titles and descriptions. For this process, we employed en_core_web_trf, its highest-accuracy transformer-based model for English. Then, we performed “part-of-speech tagging” to classify tokens as nouns, adjectives, or verbs and retained only their base forms through lemmatization. Lastly, we took into account bigrams to combine words often used together, such as in “decision making”, “public speaking” or “criminal justice.” After checking multiple thresholds (50, 100, 150, and 200), we defined bigrams as two words that co-occur 100 times or more in course titles and descriptions, yielding the most reliable set. We then combined these two words into a single token, creating 6,128 bigrams from our data.
Methods
As the significance of interdisciplinary research has been highlighted, measures of interdisciplinarity have largely been developed. Scientific articles are often the empirical site where interdisciplinarity is measured as an outcome of interdisciplinary research. Naturally, bibliometrics provide tools to measure interdisciplinarity in academic articles. There are two common approaches of measuring interdisciplinarity in bibliometrics: structural relationships and spatial distances (Wagner et al., 2011). The first set of measures uses relational information from academic articles, such as collaboration or citation networks (e.g., Schummer, 2004; Klein, 2008; Levitt and Thelwall, 2008). The second set of measures locates academic articles in a semantic space and calculates the distance between them. In this approach, interdisciplinarity is measured in three dimensions: variety (number of categories), balance (evenness of distribution), and disparity or similarity (degree of difference) (Wagner et al., 2011). As natural language processing techniques have evolved and become available in public datasets, researchers earn stronger tools with which to employ distance-based methods (e.g., Xiang et al., 2025).
We relied on previous developments in measuring interdisciplinarity in academic articles. Since our data, syllabi, lack information on co-teaching or reference lists, applying the structural relationship approach was not suitable. Therefore, we focused on measuring interdisciplinarity using spatial distances as a tool. We tested the interdisciplinarity of course syllabi using three approaches: lexical, topical, and pedagogical composition. The lexical approach measures the similarity of term frequency distribution to determine how similar broad fields are to each other. The topical approach measures the balance of distribution to determine interdisciplinarity. Lastly, the pedagogical approach analyzes not the course contents, but the types of intellectual activities pursued by lecturers. The stable composition of these three measures within a discipline over time shows persistence of an intradisciplinary curriculum, while changes suggest shifts toward interdisciplinarity. We explain each approach in the following subsections.
Lexical composition
To compare the lexical composition across broad fields, we used the distribution of tokens from the course title and description by year. From the processed text data described above, we selected only nouns and adjectives because these parts of speech were the most accurate representation of course content. Subsequently, we compiled the occurrences of each extracted token by broad field and year, and created the frequency distribution. Then, the similarity between these distributions was quantitatively assessed using cosine similarity, a metric for measuring interdisciplinary lexical similarity. Cosine similarity is a widely used metric that measures the similarity of two vectors by computing the cosine of the angle between the vectors. This measure is particularly useful compared to other measures such as Euclidean distance or Jaccard similarity when you compare two vectors with different sizes. For example, if you compare two vectors, (1, 2, 3) and (2, 4, 6), they have the same pattern except the size. Cosine similarity of these two vectors is 1, meaning that they are perfectly matched. In contrast, when we calculate the Euclidean distance between these two, it is a square root of fourteen. Since our term frequency distributions have different sizes depending on the size of broad fields, we chose the measure that can calculate similarity regardless of the size.
With cosine similarity, we compared how similar the token frequency distributions were across different categories within the same year, and checked if these similarities held over time. This approach helped us see simultaneously whether the use of popular tokens had changed within and across academic fields. By doing this, we tracked the interdisciplinarity of academic content that evolved or stayed the same across different broad categories and through the years.
Topical composition
In addition to counting token occurrences, we compared the topical composition of syllabi within and across broad fields over time. To identify the topics within the syllabi, we applied the Structural Topic Model (STM), which has been popularly used for distilling topics from various types of documents, such as open-ended survey responses and academic article abstracts (Hannigan et al., 2019; Hofstra et al., 2020; Roberts et al., 2014). Similar to our lexical analysis, we only selected nouns and adjectives as they represent the core concepts in scientific knowledge. The STM is a natural language processing technique based on unsupervised learning (Roberts et al., 2014). Unsupervised learning means the model has no prior knowledge of what the topics should be; it only observes topics based on the pattern of word co-occurrence within documents. Then, the model summarizes the given texts as a composition of latent thematic dimensions. In simple terms, when words often co-occur within documents, the model groups them into a latent thematic dimension or topic. When those words are observed in a document, the model assigns a higher probability that the document will be classified into the topic. This idea of STM is matched with how previous research conceptualizes scientific knowledge, particularly when they use natural language processing techniques (Hofstra et al., 2020; Cheng et al., 2023; Key and Sumner 2019). The final STM model provides two sets of findings. The first set is a list of topics that most optimally describe the corpus, along with keywords per topic. The second set is a list of documents (in this case, syllabi) represented by a mixture of the provided topics, each with a weight.
Using our tokenized text data, we implemented the STM with 15 topics. The number of topics was chosen to maximize semantic coherence—where higher semantic coherence means more coherent topics—and minimize exclusivity residuals, where lower exclusivity residuals indicate more exclusive topics. By comparing these two measures and manually reviewing the results, we determined that 15 topics were the most optimal (see Supplementary Figs. S2 and S3 online for more information on measures and diagnostic values.) The keywords and portion of 15 topics are shown in Fig. 2. Since the STM algorithm sorts keywords into topics in a way that optimally allocates terms by topic, the resulting topics may not perfectly align with human perception. For example, the term “forensic” in Topic 7 does not align with the other seemingly relevant terms related to mathematics in the same topic. Although there are a few exceptions, we use this result as is instead of adding human judgment to the model because authors’ expertise is limited and/or biased and cannot span the entire field of science.

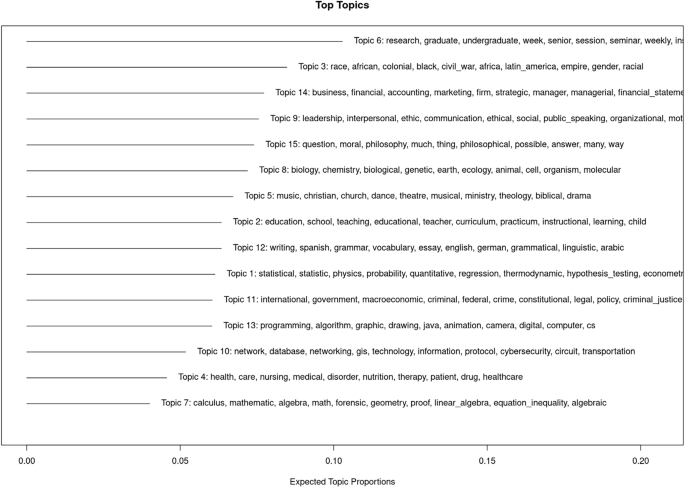
The list of words next to the topic number indicates the top words selected by the FREX (frequency and exclusivity) score for each topic.
With these fifteen topics, we allocated each topic to one of the five broad fields based on the field that predominantly represented the topic. To determine the field, we analyzed the overall topic distribution across the five fields, and identified the field that discussed the topic most extensively in 2004. For example, Topic 5 was categorized as an arts and humanities topic because this topic accounted for 23% of arts and humanities content in 2004, compared to only 1.2% in social sciences, 1.7% in natural sciences, 0.6% in engineering and technology, and 1.1% in medicine and health sciences. Following this criterion, we found three topics associated with arts and humanities (3, 5, 12), two with engineering and technology (10, 13), one with medicine and health sciences (4), three with natural sciences (1, 7, 8), and four with social sciences (2, 9, 11, 14). We excluded Topics 6 and 15 from the analysis due to their lack of clear correspondence with established academic disciplines. Topic 15 is borderline because the list of keywords includes arts and humanities keywords, such as moral and philosophy, but also stop words such as much, thing, and many. To determine whether Topic 15 is irrelevant, we checked additional keywords beyond the ten shown in Fig. 2. These keywords include different, view, mind, insight, philosopher, sense, thought, deep, reason, and one. Based on this list, we decided that Topic 15 is too general to categorize into one broad field. Also, there was one exception: Topic 2. The keywords representing Topic 2 include keywords such as education, school, teaching, and curriculum. Although this indicates that Topic 2 relates to educational themes and that its broad field is the social sciences, this topic most stood out in medicine and health science in 2004, at 11%. However, we assigned this topic to the social sciences, which includes education, because Topic 2 occupied a comparable portion (10%) in 2004 and was more closely related in terms of keywords. Lastly, we checked the validity of our topic categorization by examining the thirty syllabi with the largest proportion of each topic. We confirmed that all of the top thirty syllabi are from disciplines within the assigned broad field.
With the topic model results, our main goal of the analysis was to detect shifts in the content of each broad field, thus providing insights into the evolution of academic fields. This structured allocation allows for a focused analysis on the representation of academic content within syllabi, facilitating a nuanced understanding of disciplinary interrelations and content distribution.
Next, we grouped the initial topic distribution within each syllabus to align with the newly assigned broad categories, examining these groupings’ distribution across different categories and years. To assess the variations in these distributions, we employed the Herfindahl–Hirschman Index (HHI), a metric traditionally used in economics and finance to gauge the level of market concentration and, by extension, the competitive landscape of an industry. By applying the HHI to academic topic distributions, we quantified the concentration and diversity of disciplinary content within and across academic disciplines over time. As a pilot study, we manually selected ten interdisciplinary syllabi and ten discipline-based syllabi used in 2019. Then, we calculated the HHI to validate our approach and found that the HHI of the interdisciplinary classes was approximately one-third that of the discipline-based classes, and statistically significant with .05 alpha level. This indicates that the topics are more spread out among the interdisciplinary syllabi. More details are included in Supplementary Figs. S4 and S5 online.
Verb composition
Lastly, we focused on whether the curricula across broad disciplines have shifted toward pursuing more complex educational goals necessary for interdisciplinary research. We analyzed the verbs used in syllabi to infer the pedagogical strategies offered by instructors. We used Bloom’s taxonomy, a well-known framework for classifying educational goals (Krathwohl, 2002), to distinguish different orientations in educational curricula. This taxonomy ranks cognitive skills from basic to complex: remember, as the most basic skill, followed by understand, apply, analyze, evaluate, and finally create as the most complex skill. The framework also associates commonly used action verbs with each level of cognitive complexity. Since its initial development in 1956, Bloom’s taxonomy has been modified multiple times to reflect ongoing changes in pedagogical approaches and language itself.
To reflect these changes, we incorporated action verbs from Northeastern University (Northeastern University, Accessed 2025) and added verbs from the revised Bloom’s taxonomy from the State University of New York at Buffalo (The State University of New York at Buffalo, Accessed 2025), and the University of Utah (The University of Utah, Accessed 2025) to make the list as comprehensive as possible. We list all verbs and their classification into six categories in Supplementary Table S2 online.
We matched the action verbs used in syllabi with the corresponding cognitive skills from Bloom’s taxonomy. We extracted only the verbs using part-of-speech tagging from the same corpus we analyzed earlier. We then investigated how the focus of education had shifted by looking at the distribution of cognitive skills in syllabi, broken down by year and broad field.
Among the 258 words in our taxonomy, 90 were found to fit into multiple skill categories, with some fitting up to five categories (for more details, see Supplementary Table S3 online). For example, the verb “explain” could correspond to the skills of understand, apply, analyze, evaluate, and create in learning objectives. We reviewed each word’s meaning and concluded that many were broad enough to be categorized into multiple levels. To address concerns about the over-representation of words that appear in multiple categories, we introduced a weighting system. Words that appeared in two categories were assigned a weight of 0.5 per skill, those appearing three times received a weight of 0.33 each, those appearing four times received 0.25 each, and those appearing five times received 0.2 each. For instance, when the word “explain” appears in a syllabus, rather than assigning a weight of 1 to each of the skills understand, apply, analyze, evaluate, and create, a weight of 0.2 was assigned. Using these weighted values, the proportion of each skill was then calculated.
link